5 Things You Should Know About Phosphorus

1. The two accepted soil phosphorus tests in the North Central Region are the Olsen and Bray-P1 methods

The Olsen (bicarbonate) method is the standard soil P test in the North Central region. This method was developed to work on soils with low and high pH. The Olsen method works well in precision soil sampling, where the same field may have zones with acidic and calcareous soils. The Bray P-1 method is another accepted method in our region, but not always recommended. This method was developed in the U.S. Corn Belt, has a long history of soil test calibration studies and works well on acidic soils. The Bray P-1 method fails on soils with pH greater than 7, producing results with false low soil test P. Therefore, it has remained limited to the U.S. Corn Belt proper. The Mehlich-3 method was introduced as a multi-nutrient soil extractant. But like the Bray P-1 method, the acidic Mehlich-3 method does not perform well on calcareous soils; therefore, it has not gained approval by universities in the northern Great Plains and Canadian Prairies.

All soil P test methods are designed to predict the probability of crop response to P fertilization. The methods measure the plant-available P pool. Since the soil test method is an index of availability, the units are reported in parts per million (ppm) and ranked low, medium, or high based on university soil test calibration research. No soil P test method measures the actual pounds of available P in soil, they are only indexes of crop response.

 2. Most soils in the Northern Plains/Canadian Prairies region could use more phosphorus

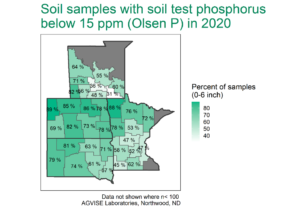
Soils in the region are naturally low in P and historical P fertilizer use has been low, relative to crop P removal. As a result, many areas in the region still have low soil test P (below soil test critical level of 15 ppm Olsen P) after many decades of crop production. In other words, most farmers are not over-applying P. In fact, soils with low soil test P should receive moderate to high rates of fertilizer P each year to achieve good crop yield and maximize profitability.

Figure 1. Map developed using AGVISE soil test data. AGVISE has created regional summaries like this for the past 40 years. Check out the summary data for Montana and Canada and summaries of other nutrients and soil properties here.

3. You should use starter phosphorus fertilizer

Starter fertilizer placed near, or with the seed, is critical for crops like corn and wheat, regardless of soil test P level. A P fertilizer band placed near the seed will ensure soluble P near developing plant roots and results in vigorous early season growth, which is important in cold, wet soil conditions. Placing P fertilizer in bands also improves P use efficiency, especially in soils with relatively low or high pH. Phosphorus availability is greatest near soil pH 6.5. Since changing soil pH is difficult and costly, fertilizer P use efficiency is more easily improved with application in fertilizer bands to reduce the volume of soil involved in P fixation reactions.

4. Phosphorus source doesn’t really matter

No matter the starting material, all P fertilizers go through the same chemical reactions in the soil. It does not matter if the fertilizer starts as a poly-phosphate or ortho-phosphate. Within about one week in the soil, all P fertilizer sources react to form lower solubility compounds. What is more important than source is the placement of the fertilizer to increase availability (banding) and the rate of actual P fertilizer applied.

5. Phosphorus can be an environmental concern

Phosphorus entering surface waters can create algae blooms and fish kills. Since P is not mobile in soil, the P leaching risk is very low. However, P does move to surface waters with soil particles when erosion occurs. In cold climates like those on the northern Great Plains and Canadian Prairies, dissolved P released from vegetation can move with snow melt to surface water.

For more information about phosphorus and its reactions in soil, explore the links below:

Understanding Phosphorus in Minnesota Soils (Univ. Minnesota)

Understanding Plant Nutrients: Soil and Applied Phosphorus (Univ. Wisconsin)

Phosphorus Facts: Soil, plant, and fertilizer (Kansas State Univ.)


5 Things You Should Know About Calcium

1. Calcium (Ca) is abundant in soils of the upper Midwest, northern Great Plains, and Canadian Prairies; calcium deficiency in agronomic crops is rare

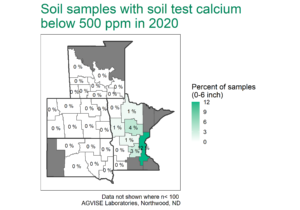
Calcium makes up about 3.6% of the Earth’s crust, and it is relatively abundant in agricultural soils across the region. In soils with pH greater than 6.0, Ca is the dominant cation (positively charged ion) on the cation exchange capacity (CEC). Since most soils in the region have a pH of 6.0 or above, calcium is very abundant and soils with low soil test Ca (less than 500 ppm) are rare (Figure 1).

Soil samples with soil test calcium below 500 ppm in 2020

Figure 1. AGVISE regional soil test summary. AGVISE has created regional summaries for the past 40 years. You can find more soil test summary data, including Montana and Canada, here.

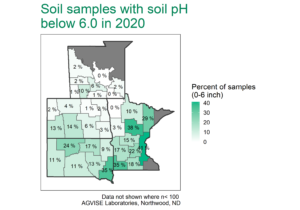
Potential calcium deficiencies are most common on sandy soils with strongly acidic pH (pH less than 5.0). Luckily, the fix for low soil pH also fixes potential Ca deficiencies. To correct soil pH, agricultural limestone is applied to raise soil pH to 6.0 or 6.5, if growing sensitive crops like alfalfa or clover. When limestone (calcium carbonate) is applied in tons per acre, more than enough calcium is also applied and sufficiently increases soil test Ca, providing ample calcium for optimal crop growth and development. Throughout the region, soils with low soil pH are more common in the higher rainfall areas to the east and south (Figure 2), and liming is a standard practice to correct soil pH and provide calcium.

Soil samples with soil pH below 6.0 in 2020, for 5 things you should know article

Figure 2. Soil samples with pH below 6.0 in 2020, where lime application may be required. The number of fields with low pH has increased over time and will continue to do so because soil acidification is a natural process. Keep watch for low soil pH, especially in western North Dakota and South Dakota. You can find more soil test summary data, including Montana and Canada, here.

2. Multiple calcium fertilizer sources exist; some increase pH, others do not

Agricultural limestone is the most common lime source and is available in two flavors: calcitic (calcium carbonate, <5% magnesium) or dolomitic (calcium-magnesium carbonate, >5% magnesium). Limestone quarries exist in southern Minnesota and Iowa, but the northern Great Plains is virtually devoid of mineable limestone. Industrial waste lime (spent lime) is another good lime source and available from sugar beet processing plants and water treatment plants throughout the region. Any of these liming materials will supply enough calcium to increase soil test Ca if soil pH is increased above pH 6.0.

Gypsum (calcium sulfate) is another calcium source, but it does not change soil pH. Gypsum is sometimes used to increase soil test Ca if the producer does not want to increase soil pH with lime application. This situation is common in irrigated potato production where increased soil pH may increase soil-borne diseases like common scab of potato. Gypsum is not a lime source, so it will not increase soil pH.

3. There is no “ideal” base cation saturation range or ratio for calcium

Suggestions that Ca and other base cations (magnesium, potassium) are required in a certain percentage or ratio in soil are not supported by modern science. Recent research done at several universities shows a wide range of base cation ratios in soil will support normal crop growth (see links below). What is important is that a sufficient soil test amount of each base cation (Ca Mg, K) is present in soil to support plant growth and development.

4. Soils with pH greater than 7.3 will have falsely inflated soil test Ca and cation exchange capacity (CEC) results

Soils with pH greater than 7.3 will contain some amount of naturally occurring calcium carbonate (CaCO3), shown on the soil test report as carbonate (CCE). The calcium soil test method will extract Ca on cation exchange sites and some Ca from calcium carbonate minerals, resulting in an inflated soil test Ca result. Starting with inflated soil test Ca, the routine cation exchange capacity (CEC) calculation is also inflated. For example, a soil with pH 7.8 and 3.0% CCE may report CEC at 60 meq/100 g, but the correct CEC is only 27 meq/100 g. To obtain accurate CEC results on soil with pH greater than 7.3, a special displacement CEC laboratory method is required. For soils with pH less than 7.3, the routine CEC calculation method will provide accurate soil test Ca and CEC results. High soil salinity (soluble salts, EC) can also inflate CEC results.

5. Calcium is not an environmental risk to surface or ground water

Calcium is one of the major dissolved substances found in surface and ground waters, especially in the northern Great Plains and Canadian Prairies. In fact, water hardness is determined from the amount of dissolved calcium and magnesium in water. There is already so much calcium found in natural waters in the region that calcium fertilizer additions to soil are negligible. Water hardness does affect the effectiveness of some herbicides and may cause tank-mixing issues, but is not an environmental concern.

Bonus: Just because your tomatoes have had blossom-end rot does NOT mean your soil is Ca deficient!

If you are a backyard tomato grower, you may have experienced blossom-end rot before, where the blossom-end of developing fruits turn brown and mushy while still on the plant. Yes, the problem is caused by low calcium in the tomato plant, but not necessarily because the soil has low soil test Ca. Blossom-end rot is primarily caused by inconsistent soil moisture. Adequate soil moisture is required to maintain a consistent supply of calcium moving to the plant root, which might run short if watering is inconsistent. To keep blossom-end rot away from your garden, just try to be more consistent with watering, especially during dry periods.

Resources on Base Cation Saturation Ratios

Cation Exchange: A Review, IPNI

Soil Cation Ratios for Crop Production, UMN

A Review of the Use of the Basic Cation Saturation Ratio and the “Ideal” Soil, SSSA Journal

High Soil Nitrogen following Drought: How to manage next year

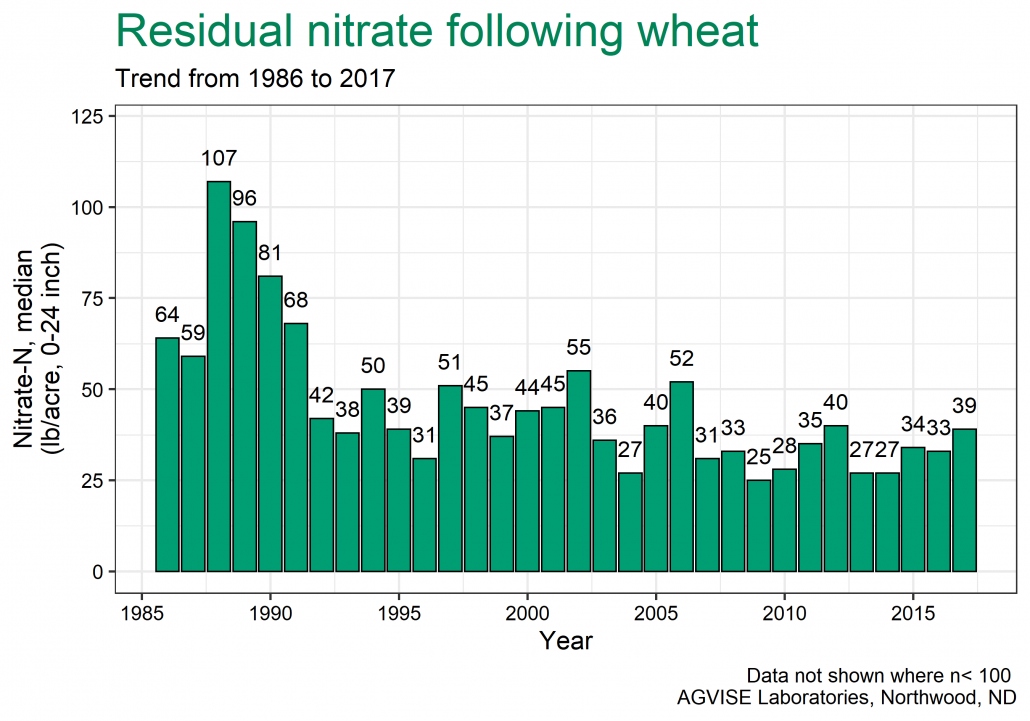
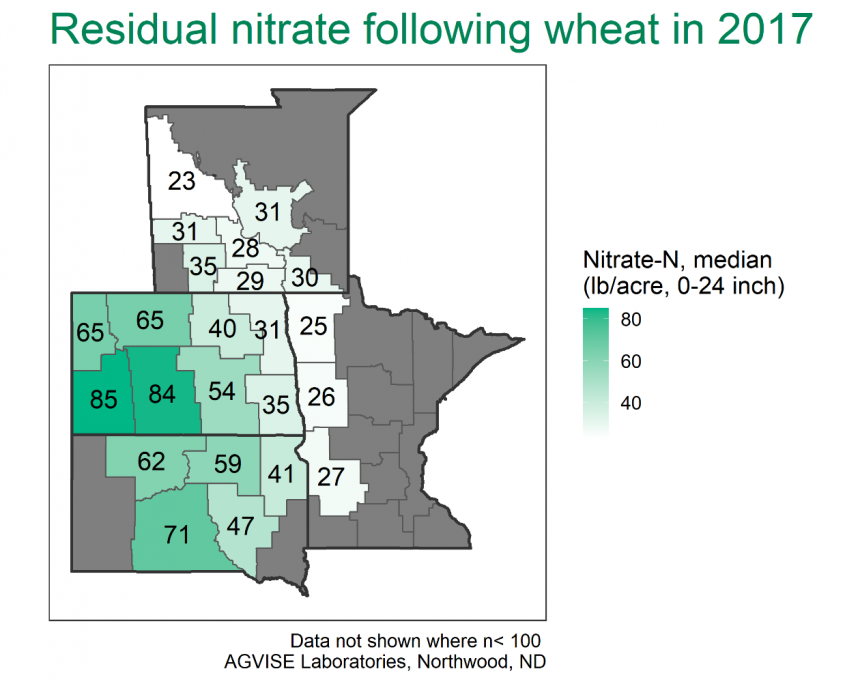
From time to time, moderate to severe droughts hit the Great Plains. Such is life in semi-arid climates. When a drought occurs, it is normal to find higher residual soil nitrate-nitrogen after harvest. Since the widespread adoption of soil testing in the 1970s, we have seen this phenomenon in all major drought years: 1988, 2002, 2006, 2012, 2017 (Figure 1). The lack of precipitation and exhausted stored soil water reduces crop growth and yield, meaning much of the applied nitrogen fertilizer remains unused, showing up in the residual soil nitrate-nitrogen test. In 2017, very high residual soil nitrate-nitrogen was observed across wide geographies of western North Dakota and South Dakota (Figure 2).

Figure 1. Residual soil nitrate-nitrogen following wheat on the northern Great Plains.


Figure 2. Residual soil nitrate-nitrogen following wheat on the northern Great Plains in 2017.


Following a drought, we often get the question, “Can I count on all the soil nitrate in my soil test for next year’s crop?” The simple answer is yes; you can count on the amount of soil nitrate-nitrogen in the soil test, but you must consider additional factors. Even in drought, some parts of each field will produce higher crop yield than other parts because the better soils have higher water holding capacity (e.g. higher clay content, higher organic matter). In the high yielding zones, there is less residual soil nitrate remaining in the soil profile. Drought will create more variability in crop yield and residual soil nitrate, mostly driven by topography and soil texture.

Let’s imagine you had a wheat crop severely affected by drought, but some parts of the field still had 50% normal yield (maybe lower landscape positions, greater water holding capacity). Following harvest, the whole-field composite soil test showed 140 lb/acre nitrate-N (0-24 inch). You were skeptical about that very high residual soil nitrate level, so the crop consultant resampled the parts with better crop yield, which then had 80 lb/acre nitrate-N (0-24 inch). Using the whole-field composite soil test result of 140 lb/acre nitrate-N (0-24 inch), you would only need to apply some starter nitrogen fertilizer for next year’s crop. However, if you only applied starter nitrogen, the high yielding parts of the field with only 80 lb/acre nitrate-N (0-24 inch) would be under-fertilized, costing crop yield and profit next year, on the best soils in the field.

If you only have a whole-field composite soil test result, you must consider spatial variability in residual soil nitrate across the field. You will want to apply a base nitrogen fertilizer rate to cover the parts with lower residual soil nitrate than the field average. The base nitrogen fertilizer rate may range between 30 to 60 lb/acre N, depending on spatial variability and risk tolerance. If you do zone soil sampling, you have a much better idea of spatial variability and nitrogen fertilizer needs in all parts of your fields. Through productivity zone soil sampling, you know the residual soil nitrate level in each management zone, and you can choose different nitrogen fertilizer rates across the field.

If you only soil sample the surface soil depth (0-6 inch), you are missing 75% of the plant-available nitrate-nitrogen pie. To make good nitrogen decisions, you should collect 0-24 inch soil samples for soil nitrate-nitrogen analysis. In drought, plant roots explore deep for stored soil water and uptake whatever nitrate is found along the way. There is no way to model how much soil nitrate remains in the soil profile after drought. Following drought, the best strategy is 24-inch soil sampling and breaking fields into several management zones to determine the proper amount of nitrogen fertilizer required.